[Read time: 8 minutes]
Back in March of 2020, we wrote a blog called, “How COVID-19 has affected America’s Shopping Behavior?” in which we surveyed 10,000 people and compiled their results.
Obviously, things have changed quite a bit since then so we’re here to take another poll of the American general public to see how their shopping habits have changed...or stayed the same.
We already knew that people were shopping online more. 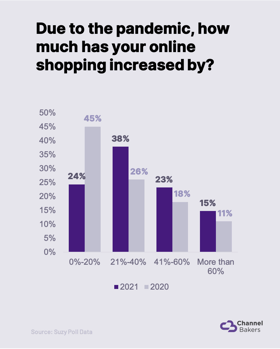 eMarketer told us at that time that eCommerce increased 27.6% in 2020, but what about people’s individual shift to online shopping?
Last year in March, 45% of participants indicated that their online shopping increased 0%-20%. This year, participants boosted their shopping into the 21%-40% category with 38% responding that they shop online that much. Only 24% of respondents stayed in the 10%-20% category after a year in quarantine.
Also interesting, people who increased their online shopping to the 41%-60% jumped from 18% to 23% of respondents and those who shopped 60% or more online rose from 11% to 15%. This means that the online shopping trend didn’t seem to slow down and had strong growth for a full 12 months.
Average Order Value
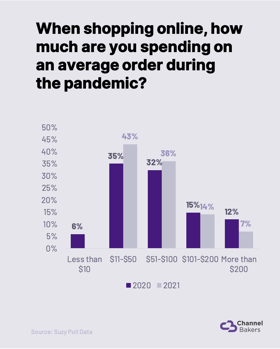
To follow up from last year, we wanted to see if people were still spending around the same amount on average per order. In 2020, 79% of people responded saying that they spend up to $100 and 21% said they go over the $100 mark per order.
This year, we found that 73% of respondents spent up to $100 per order with 6% of them spending under $10 on low ASP purchases.
What’s interesting to see is the growth of those who spend more than $100 rising from 21% in 2020 to 27% in 2021 (a 6% YoY increase).
This aligns with a previous poll we took, showing results that over half of respondents are still buying big ticket items and 71% are going for the premium brand over the value brand.
Most Shopped Category of Products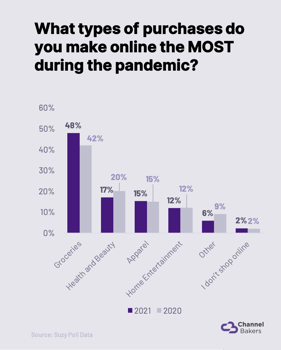
With the rise of BOPIS (Buy Online Pickup In Store) and Instacart’s massive growth, groceries are still at the top of the list for the most shopped categories in 2021. However, it did drop a bit from last year going from 48% to 42% (grocery dropped by 6% YoY).
As expected, this audience was still stocking up on their vitamins and supplements with Health and Beauty rising from 17% to 20%. More and more people are taking stock in their health these days, which is never a bad thing. At least toilet paper is off the lists...for now.
Surprisingly, Apparel and Home Entertainment stayed at exactly the same percentage with 15% and 12% respectively.
Intraday Online Shopping Frequency
Being stuck at home gives us all ample opportunity to buy a new meat thermometer or a remote-controlled BB-8 droid, but how often do we actually do it? According to the people we surveyed, at least it’s not more than 4 times a day.
Only 4% of respondents go online shopping more than 4 times a day, but that number jumps to 15% for those who fill their online carts 3-4 times per day. We assume that the other 81% of us are getting more efficient at shopping (are we all using Alexa shopping lists?).
Where are People Shopping Now?
With the continual rise of eCommerce, we took a stab at finding out if people will bring their brand loyalty online and stay true to their typical shopping habits. Will they still go to Walmart for everything? Will Amazon completely take over? Is Costco going to see massive growth due to their members-only prices?
Amazon.com
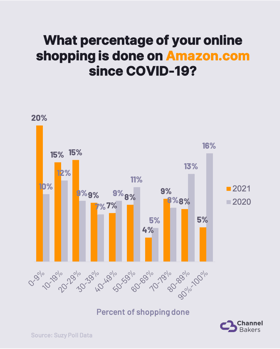 Amazon was the frontrunner back when the pandemic began with 53% of respondents saying that they do more than half of their shopping there, but that changed in a year. Now, only 34% of those surveyed say they shop 50% or more on Amazon with a dramatic shift of those who say they spend 90%-100% of their shopping on Amazon dropping from 16% of respondents to 5%!
This could be because we took last year’s survey right when Amazon was becoming everyone’s go-to for eCommerce. But with 0% across the board for our next competitors in the 90%-100% range, at least Amazon has some extremely loyal customers.
Also, those who shopped on Amazon for 0%-9% of their time doubled from 10% to 20% of those surveyed. So, people are spending less of their shopping budgets on the retail giant and more on other sites. However, something tells us that Amazon is going to be just fine.
Target.com
Target’s respondents who say they shop online at Target.com between 0%-9% rose to 68% which is an 18% increase over last year.
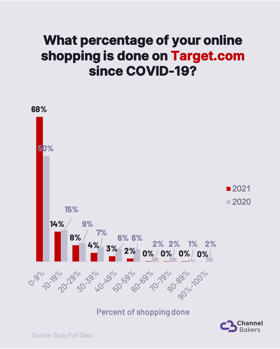
They matched Walmart.com in the categories of 10%-19% and 20%-29%.
Although our survey showed a drop when it came to shoppers doing 60% of their shopping and above, we gathered a lot of information from their earnings call that was very encouraging.
So let’s talk about that… Target’s digital sales grew 145% YoY! They also had an increase of 15% in basket growth, and we learned that multi-channel guests spent on average nearly 4x more per visit than store-only guests. The big win was to see that digital-only guests spent nearly 10x more than store only guests per visit.
And unlike other companies who were late to the game, Target has been offering in-store pickup since 2013 and added curbside pickup in 2017. This led to an early adoption of customers using their Drive Up service in 2020, which saw more than 600% growth!
Walmart.com
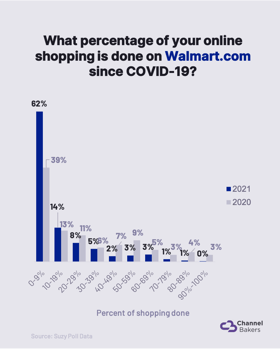 Walmart, on the other hand, took a hit to their shopping relevancy. They went from having 24% of respondents spend half their money on the big W to only 8%. That’s a third of what they were getting last year!
On a positive note, Walmart is retaining their #2 on the top eCommerce companies list going into 2021 with $64 billion in projected eCommerce sales.
Their stake in TikTok is a huge value add as well with TikTok becoming the fastest growing social media platform on the verge of revolutionizing the social commerce boom.
Costco.com
In 2020, 41% of respondents said they shop at Costco.com 10% of their store visits. This year, that number has dropped to 16%. Costco gas stations have been packed and foot traffic doesn’t seem to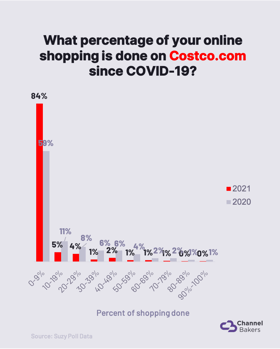 have slowed at all, so perhaps these missed online customers are simply heading in-store to do their shopping.
Curbside pickup isn’t exactly easy when you’ve got palettes of food and cleaning supplies to grab, so shopping in person might be the way to go for the Costco loyalists.
With 80% of respondents in the 10% and up bucket for Amazon, it makes Costco look like they haven’t optimized their online experience as we hoped they did. However, people are most likely spending more on a single order at Costco.com than Amazon.com. Just try shopping at Costco and not spending $200 on things you didn’t know you needed like a 3 lb bag of peeled garlic cloves.
Retail Media Advertising
Like most of the advertising industry, our clients also shifted budgets towards digital and retail media advertising.
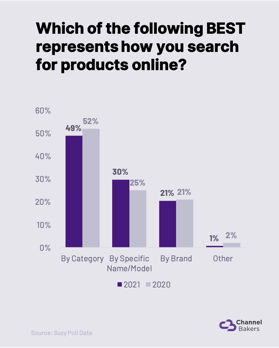
Let’s start with Branded vs. Non-Branded search behavior. According to our survey, branded searches grew from 46% last year to 53% in 2021 so far this year. Key takeaway, we, at Channel Bakers, continue to insist that brands need to protect all of their branded keywords at the very bare minimum.
We were surprised to see that these respondents stated that they search by model name and model number grew by 5% year over year. Historically we’ve seen a pattern of non-branded category based searches growing year over year, but category keyword based searches fell by 3% year over.
In 2020, we also tested what type of ads were resonating with consumers most. We found that Static and Video ads were the most intriguing to shoppers, which is the same case this year. Animated Banners took a dip from 27% of participants saying they click on them to 19%. Is this because people are getting tired of seeing so many Animated Banners as they surf the web more 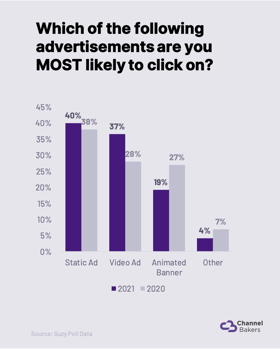 and more?
One thing that we were excited to see is that Video Ad resonance rose from 28% to 37%, which goes to show that our love for OTT and OLV is warranted. Shoppers want to see Video – How-To videos, lifestyle videos, you name it!
And if you’re looking for a high-quality, informative video to run on OTT or as an Amazon Sponsored Video Ad, don’t hesitate to reach out to your Account Executive to discuss how we can take care of that for you!
To Wrap Up
eCommerce didn’t slow down at all in 2020, especially as the pandemic kept more people indoors and online. We saw an increase in those who spent money on big ticket items while online grocery shopping dropped slightly.
Amazon still had the most loyal customers as far as online shopping goes, while Walmart, Target, and Costco lost share of those who shop 60% or more on their sites. Protecting your keywords, branded or not, is still extremely important if you want to stay top of mind and video advertising continues to be a big winner.
If you want to learn more about how to leverage shopper behavior to #GrowTheDough for your products, please don’t hesitate to contact our Client Success team at growthedough@channelbakers.com and bookmark our blog page for more real-time updates.
.jpg)
.jpg)

.jpg)